PROJECT BRIEF
Create a microsite and interactive data visualization to engage the public.
STRATEGY AND PROCESS
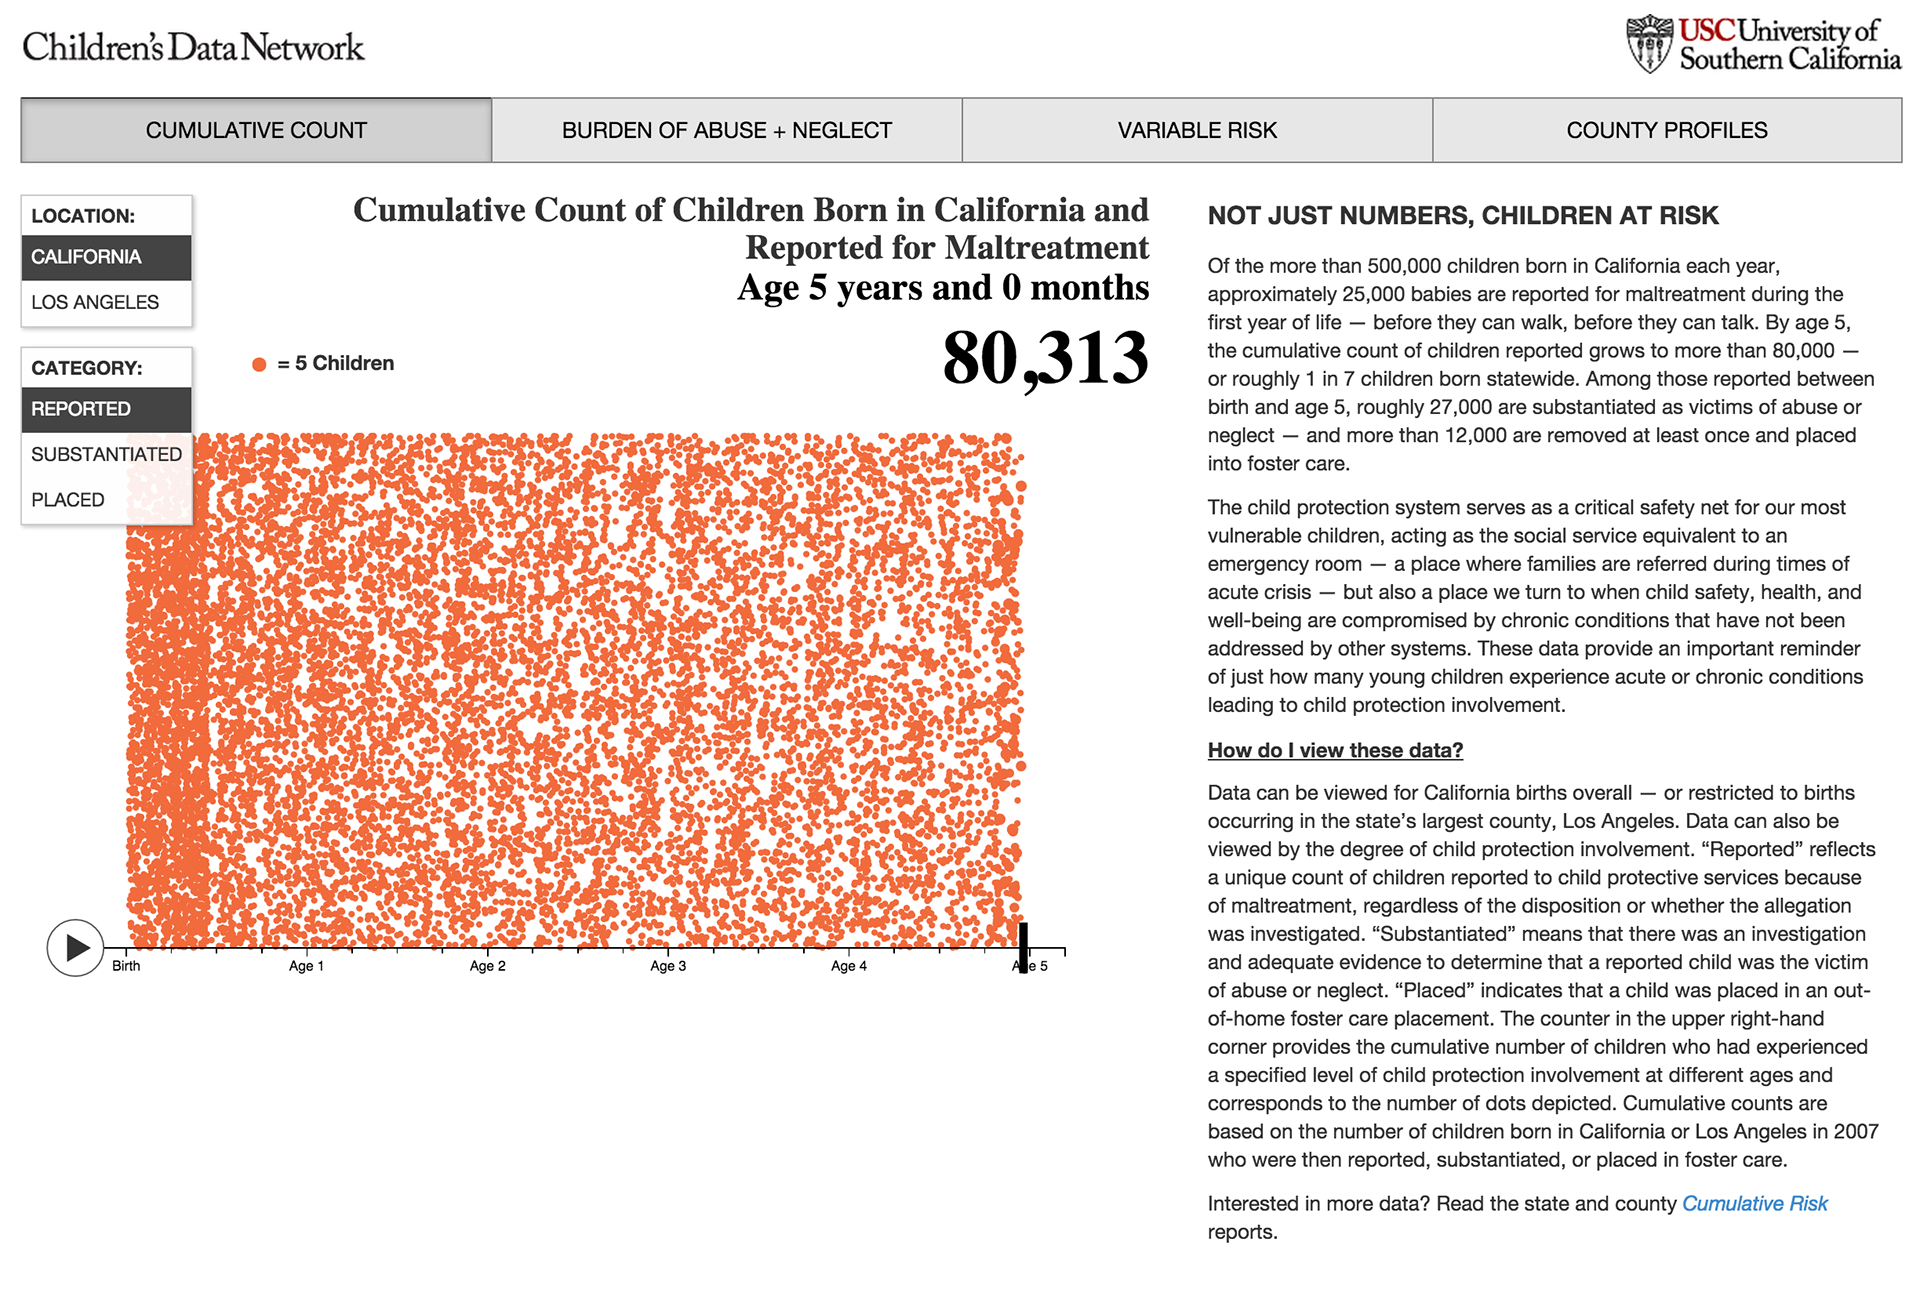
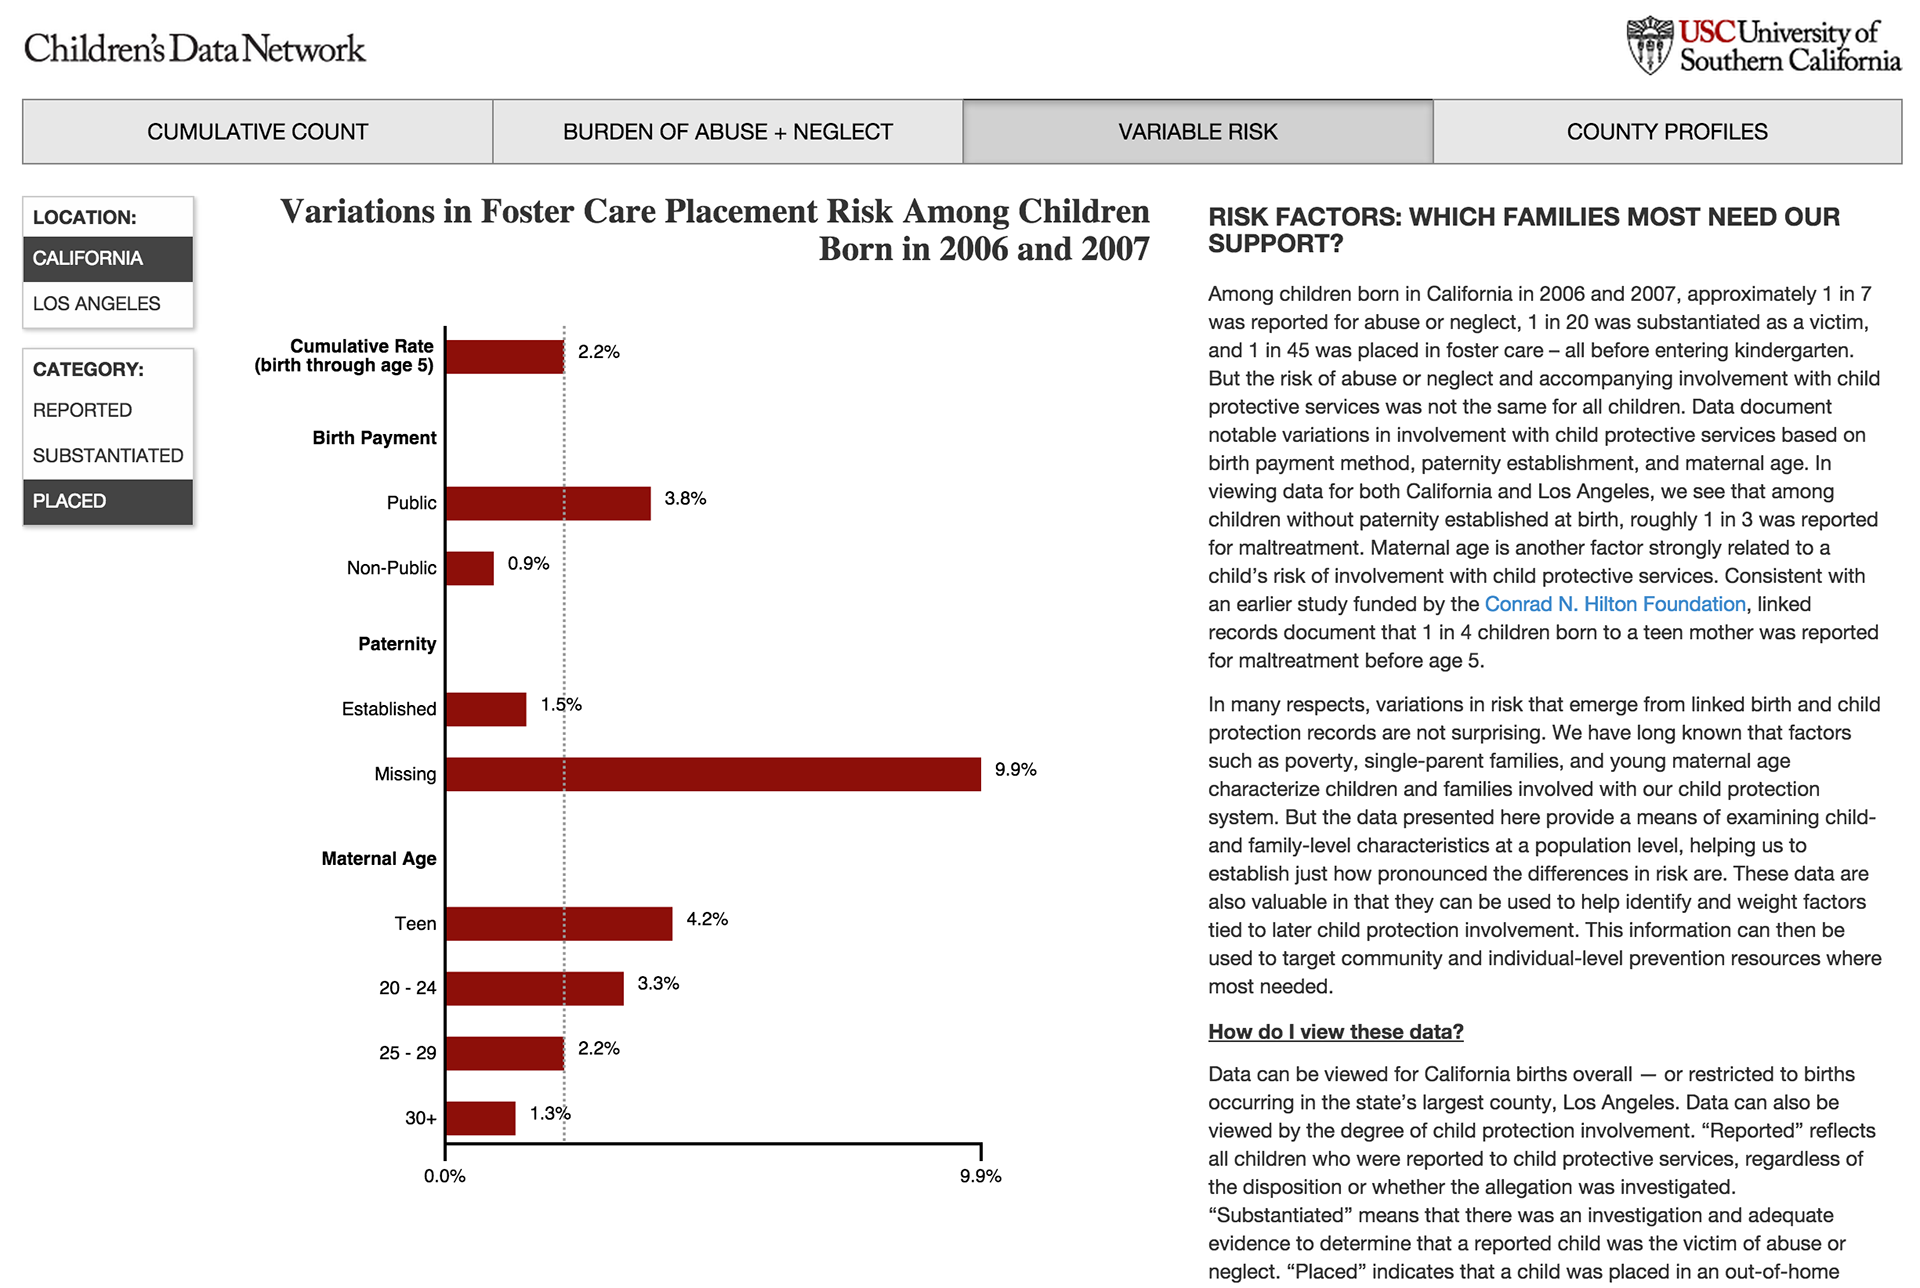
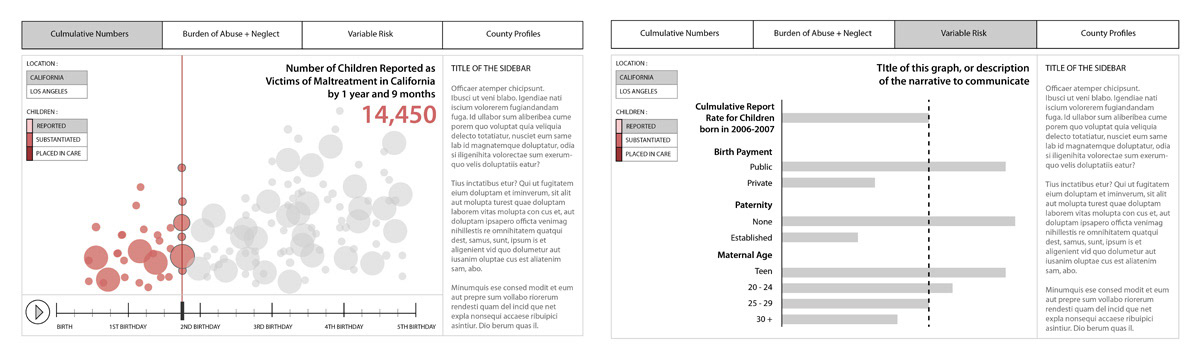
Working with researchers to understand the type of data available in their publication, I proposed a timeline based visualization that highlighted the scale of children's maltreatment. The client requested a visualization that showed a high resolution of individual impact, and after testing multiple scales and rendering constraints on an average browser we settled on a scale that surfaced information best across the multiple filters and views needed.
CLIENT
Children's Data Network | University of Southern California